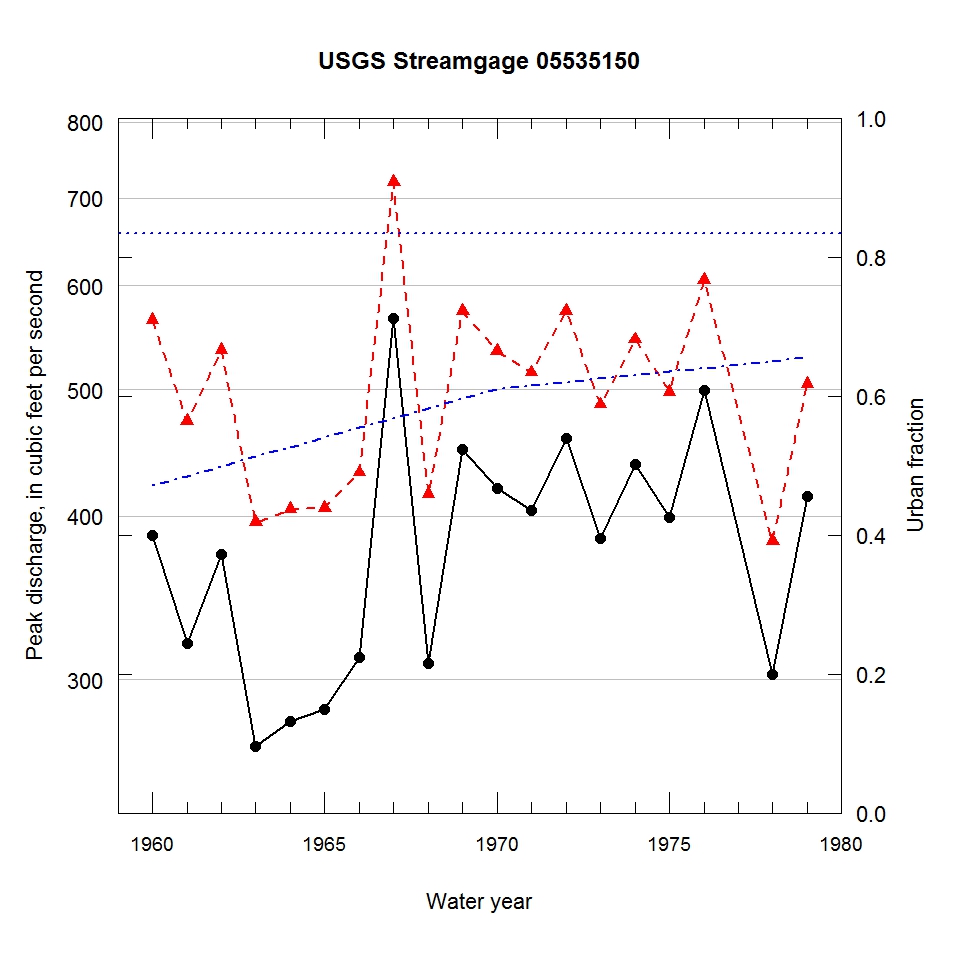
Observed and urbanization-adjusted annual maximum peak discharge and associated urban fraction and precipitation values at USGS streamgage:
05535150 SKOKIE RIVER AT NORTHFIELD, IL


| Water year | Segment | Discharge code | Cumulative reservoir storage (acre-feet) | Urban fraction | Precipitation (inches) | Observed peak discharge (ft3/s) | Adjusted peak discharge (ft3/s) | Exceedance probability |
| 1960 | 1 | -- | 0 | 0.471 | 0.436 | 387 | 565 | 0.377 |
| 1961 | 1 | -- | 0 | 0.485 | 1.255 | 320 | 473 | 0.549 |
| 1962 | 1 | -- | 0 | 0.499 | 0.233 | 374 | 536 | 0.431 |
| 1963 | 1 | -- | 0 | 0.513 | 1.262 | 267 | 396 | 0.711 |
| 1964 | 1 | -- | 0 | 0.527 | 0.793 | 279 | 405 | 0.694 |
| 1965 | 1 | -- | 0 | 0.540 | 0.525 | 285 | 406 | 0.691 |
| 1966 | 1 | -- | 0 | 0.554 | 1.148 | 312 | 432 | 0.634 |
| 1967 | 1 | 2 | 0 | 0.568 | 1.394 | 567 | 720 | 0.178 |
| 1968 | 1 | -- | 0 | 0.582 | 0.766 | 309 | 416 | 0.668 |
| 1969 | 1 | -- | 0 | 0.596 | 1.938 | 450 | 574 | 0.361 |
| 1970 | 0 | -- | 961 | 0.610 | 1.733 | 420 | 535 | 0.434 |
| 1971 | 2 | -- | 961 | 0.615 | 0.349 | 404 | 515 | 0.470 |
| 1972 | 2 | -- | 961 | 0.620 | 2.127 | 459 | 574 | 0.360 |
| 1973 | 2 | -- | 961 | 0.625 | 0.710 | 385 | 487 | 0.522 |
| 1974 | 2 | -- | 961 | 0.630 | 1.230 | 438 | 546 | 0.413 |
| 1975 | 2 | -- | 961 | 0.635 | 0.986 | 399 | 498 | 0.501 |
| 1976 | 2 | -- | 961 | 0.640 | 1.511 | 499 | 606 | 0.300 |
| 1978 | 2 | -- | 961 | 0.650 | 1.524 | 303 | 383 | 0.738 |
| 1979 | 2 | -- | 961 | 0.655 | 1.181 | 414 | 505 | 0.488 |

